Measuring Brisbane’s CO2
Carbon dioxide is the most important greenhouse gas. Globally, its concentration has risen by well over 50% since pre-industrial times, and it is heating the planet. The world’s major science agencies measure concentrations far away from cities in order to obtain representative samples unaffected by nearby sources.
Surprisingly, surface level carbon dioxide concentrations are hardly ever measured in the world’s cities, where most CO2 comes from. This is partly because as a naturally occurring gas it was never considered as a pollutant, and was left out of most Air Quality measures, (including Brisbane’s).
Our project fills this gap using low-cost but still quite accurate sensors. We collected many months of data in 2023 and 2024, and are about to start a new phase with improved methods.

What are typical Brisbane CO2 levels?
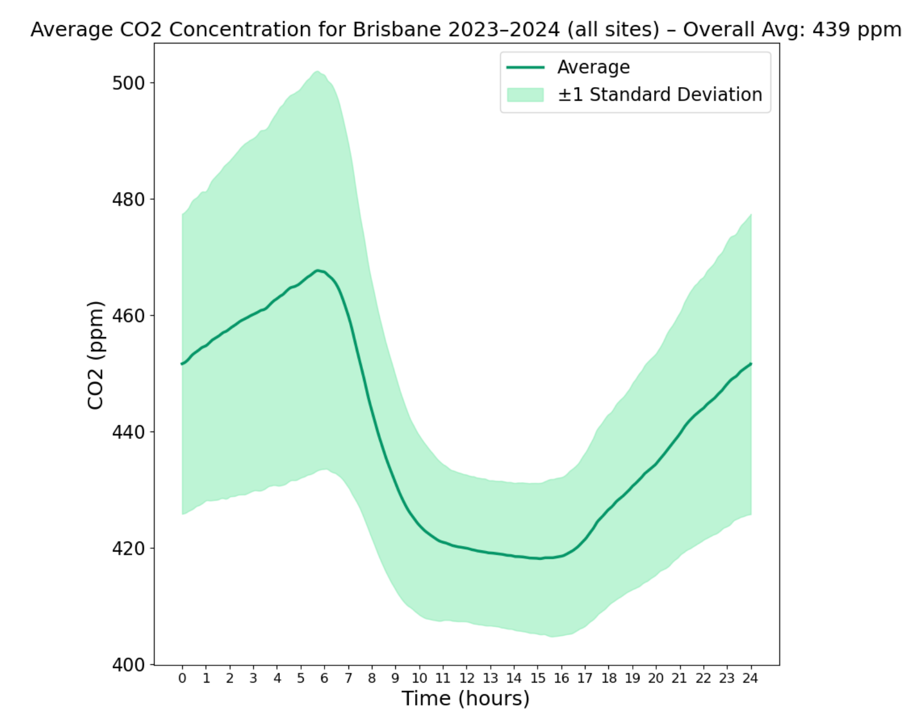
From recordings over most of 2023 and 2024 at four sites (Petrie Terrace, Chapel Hill, Bellbird Park and Kelvin Grove), we have fairly representative data for the Brisbane area across the 24-hour cycle shown on the right.
Concentrations typically rise overnight and peak just before dawn. At sunrise, winds mix the air and the ‘boundary layer’ rises, which, along with photosynthesis, lowers CO2 levels during the day to their minimum in the early afternoon, rising again until the following morning.
We measured Brisbane’s 2023/24 average as 439 ppm
compared to approximately 418 ppm for those two years, for well-mixed air measured by the CSIRO at Cape Grim/Kennaook.
Traffic emissions for Brisbane
We can clearly detect higher CO2 concentrations associated with Brisbane’s traffic.
By subtracting average weekend values from average weekday values across the 24 hours for our CBD site at Petrie Terrace, two peak-hour traffic ‘spikes’ are evident, peaking at about 7:45 am and 5:30 pm. The dashed blue line is what would be observed if there was no weekday-weekend difference.
These 6 ppm spikes underestimate traffic CO2 emissions because they only represent how much higher the concentrations are on weekdays at those times - but there is still plenty of traffic on weekends.
(This pattern reverses between midnight and about 2 am, with weekend levels higher. That’s almost entirely because of low levels early on Monday mornings dragging down the weekday average - probably because there is very little traffic overnight on Sunday and into Monday early morning).

It’s noteworthy that very similar weekday-weekend differences have been observed elsewhere - in Munich and Mexico City (data shown separately for weekdays and weekends rather than as the difference between them).
Lan, L. et al. (2020) ‘Assessment of Urban CO2 Measurement and Source Attribution in Munich Based on TDLAS-WMS and Trajectory Analysis’, Atmosphere, 11(1), p. 58. Available at: https://doi.org/10.3390/atmos11010058.
González del Castillo, E. et al. (2022) ‘CO2 variability in the Mexico City region from in situ measurements at an urban and a background site’, Atmósfera, 35(2), pp. 377–393. Available at: https://doi.org/10.20937/atm.52956.

Munich

Mexico City
Measurements
Our monitoring stations use Senseair K30 non-dispersive infra-red sensors and Raspberry Pi computers, mounted inside a housing to protect the equipment and minimise condensation. We collect data every 15 seconds using our custom software written in Python. Each station is networked so data can be downloaded regularly for analysis. Sensors are periodically re-calibrated using a 400 ppm calibration gas, and in the next phase, we are using two sensors in each site to check for ‘drift’. Together, these steps reduce error to within about 5 ppm, accurate enough to identify some important patterns.
